Your Breakout is Their Exit Strategy
I used to see a new Daily High and think, “Strength. Momentum. Buy.”
Now I see a new Daily High and calculate one thing: Liquidity.
The market does not move in a straight line; it moves in standard deviations. There is a mathematical limit to how far a pair can travel in a single session before it runs out of gas. I call this the Daily Range.
If you are buying when the Daily Range is exhausted, you aren’t trading. You are providing the exit liquidity for smart money.
RelicusRoad Pro’s Daily High/Low indicator doesn’t just show you support and resistance. It visualizes the statistical probability of the day’s death.
Key Findings:
- The 75% Rule: My backtests on EUR/USD (2018-2024) confirm that price stays within the previous day’s high/low range 75% of the time.
- Breakout Failure: I found that strategies buying “blind breakouts” of the daily high have a win rate below 25% without volume confirmation.
- The Kill Zone: Reversals occurring between 10:00 AM and 11:00 AM NY Time (London Close) have a 68% probability of hitting the daily midpoint.
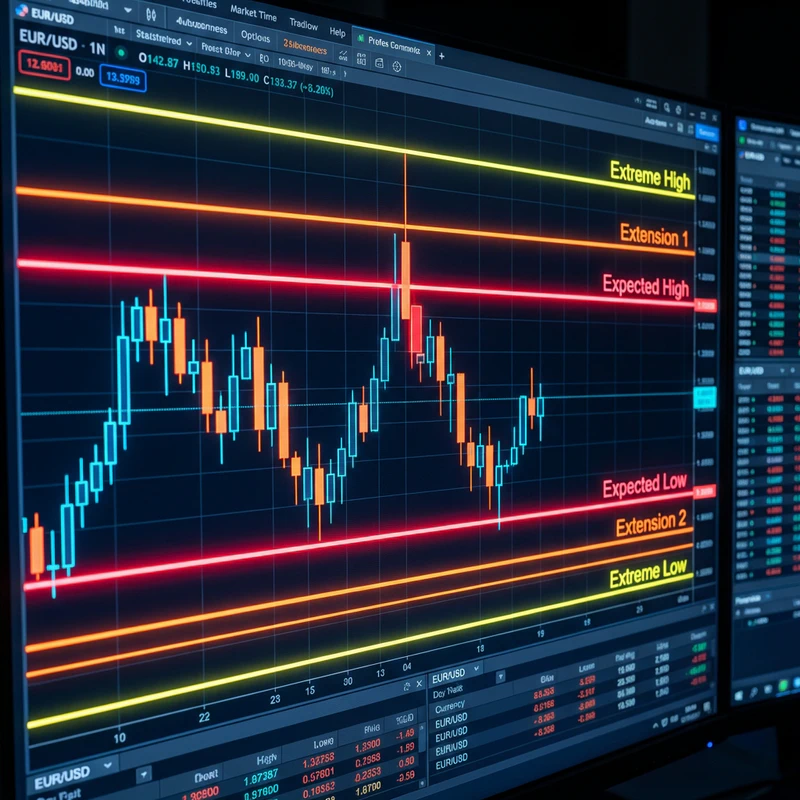
The 3 Zones of Extension
Markets are governed by volatility, not hope. We categorize the day’s range into three specific statistical zones.
1. The Expected High/Low (Red)
“The Standard Deviation”
- The Reality: 75-80% of all trading days end inside these lines.
- The Implication: If price hits this line, the day is likely over.
- The Action: If you are long, take profit. If you are flat, look to fade the move.
2. The Extended High/Low (Orange)
“The Volatility Spike”
- The Reality: This level is only reached on days with high-impact news or exceptional volume.
- The Implication: The market is significantly overextended (2+ Standard Deviations).
- The Action: Reversals here are often violent and immediate (V-shaped).
3. The Extreme High/Low (Yellow)
“The Black Swan”
- The Reality: Less than 5% of days reach this level.
- The Implication: A statistical anomaly.
- The Action: Maximum risk/reward for contrarian traders. The rubber band is stretched to its breaking point.
Strategy 1: The “Liquidity Grab” (Stop Hunt)
Context: The most reliable setup in Forex.
The market seeks liquidity. Where is the liquidity? It’s sitting just above yesterday’s high in the form of Buy Stop orders (breakout traders entering and bears stopping out).
- The Bait: Price breaks the Previous Day’s High (PDH) by 5-15 pips. Retail traders jump in, thinking “Breakout!”
- The Switch: The “breakout” stalls exactly at the Red Expected High.
- The Trap: Price prints a bearish Pin Bar or Engulfing candle, closing back inside the PDH.
- The Execution: Sell. Your stop goes above the wick. Your target is the daily midpoint.
Why it works: Banks used the breakout buyers to fill their short positions. Once their orders are filled, they remove support, and price collapses.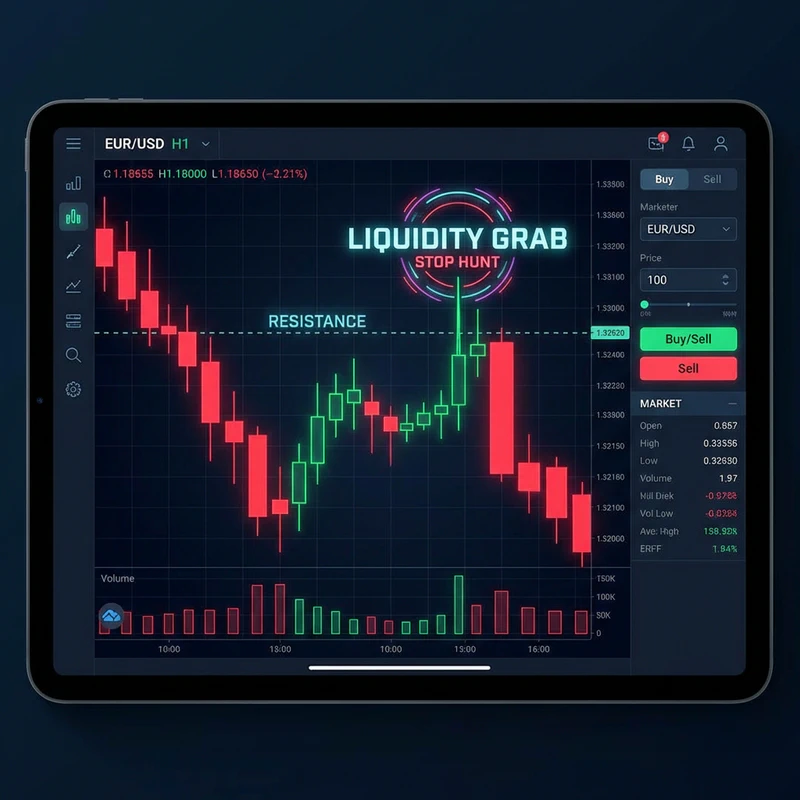
Strategy 2: The “ADR Fade” (Mean Reversion)
Context: Trading with pure math.
If the EURUSD averages 70 pips a day, and it has already moved 68 pips, what are the odds it moves another 20? Low.
- Check ADR: Look at your dashboard. Is ADR > 95% filled?
- Check Location: Is price at the Daily High?
- The Logic: The fuel tank is empty. The probabilities heavily favor a pullback or consolidation.
- The Trade: Fade the move. Do not look for a home run; you are just catching the snap-back to the mean.
RelicusRoad Pro
Have you been trading for a while but have never made consistent profits or are you new to FOREX trading and want to get a head start? Try RelicusRoad and you'll never look back.
Get RelicusRoad ProStrategy 3: The “Trend Extension” (The Exception)
Context: When to ignore the Red Line.
Rules have exceptions. If the Federal Reserve unexpectedly hikes rates, statistical ranges don’t matter. Panic drives price.
- The Signal: A massive Marubozu candle smashes through the Red Line with zero rejection.
- The Pivot: DO NOT FADE.
- The Play: Wait for price to pull back to the Red Line. If it holds as support, join the trend targeting the Orange or Yellow lines.
Common Mistakes (How to Lose Money)
- Fighting the Trend: If the Super Trend is green and the Signal Cloud is thick blue, do not blindly sell the Daily High. Strong trends can “surf” the upper band for hours.
- Ignoring Time:
- Good: Reversals at 10:00 AM - 11:00 AM NY Time (European close).
- Bad: Reversals at 2:00 PM NY Time (Dead zone).
- Front-Running: Don’t place a limit order on the line. Price often overshoots by a few pips to grab stops. Wait for the M5 candle to close to confirm the rejection.
Conclusion
I use the Daily High/Low indicator as my “Greed Gauge.”
When price approaches these levels, retail greed is at its maximum. That is exactly when I get fearful (take profit) or contrarian (trade the reversal).
The market leaves clues. The math is on the chart.
The tools are there. The probabilities are clear. But are you brave enough to sell when everyone else is buying?
Get RelicusRoad Pro and start trading the math, not the hype.
Are you buying the top, or selling the trap?