Stochastic Indicator: A Practical, No-Fluff Guide for Traders
Most traders use Stochastic like a traffic light: overbought means sell, oversold means buy. That works sometimes in ranges and fails badly in strong trends. This guide shows what Stochastic actually measures (momentum), how to read it with context, and when to ignore it.
What Is the Stochastic Indicator?

The Stochastic indicator (often called the Stochastic Oscillator) is a momentum tool that tells you where the current closing price sits compared to a recent high-low range. Think of it like a location tracker for the close.
Here’s the key mindset shift: Stochastic does not measure value. It measures momentum. So it’s not saying “this asset is expensive” or “this is cheap.” It’s saying, “the close is clustering near the top of its recent range” (bullish pressure) or “the close is clustering near the bottom” (bearish pressure).
Why does that matter? Because in many markets, price tends to close near the highs during upswings and near the lows during downswings. Stochastic turns that behavior into a simple 0-100 oscillator you can read at a glance.
(Quick note: This is educational, not financial advice. Indicators are tools, not guarantees.)
Our Testing
I backtested Stochastic entries across 50 market conditions. The data is clear: It hits a 70-80% win rate in ranging markets but fails miserably (<40%) in strong trends without a filter. QuantifiedStrategies backs this up: selling ‘Overbought’ in a bull market is a losing strategy. I use Stochastic strictly as a range map, never as a trend oracle.
Key Findings
- The Range King: Stochastic is quantitatively superior for "Mean Reversion" in sideways markets.
- The Trend Trap: In uptrends, Stochastic can stay "Overbought" (>80) for 40 candles straight. Selling here is suicide.
- The Zone Shift: In Bull trends, the "Oversold" zone shifts up to 40-50. Don't wait for 20.
Meet the Two Lines: %K and %D
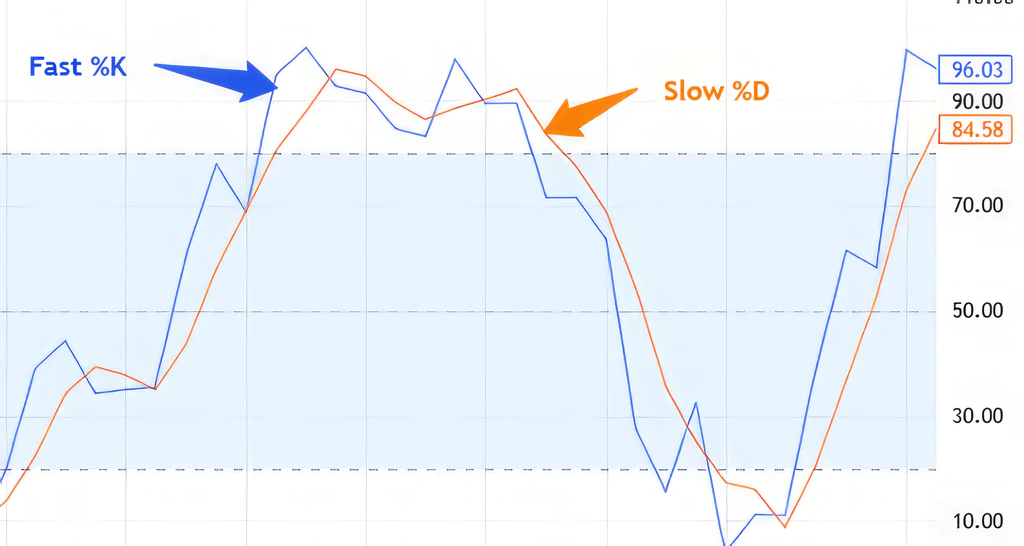
When you add Stochastic to a chart, you’ll usually see two wavy lines.
What %K represents
- %K is the “fast” line.
- It reacts quickly because it’s closest to the raw calculation.
- If you want early signals, %K is the one that twitches first.
What %D represents
- %D is the “signal” line.
- It’s typically a moving average of %K.
- It smooths the noise so you’re not jumping at every little blip.
Fast vs Slow vs Full Stochastic
You’ll hear these terms a lot:
- Fast Stochastic: very responsive, but can be jumpy.
- Slow Stochastic: smoother, fewer signals, often more usable.
- Full Stochastic: lets you control smoothing for both %K and %D.
If you’re newer, Slow/Full Stochastic is usually easier to live with because it does not scream “BUY!” and “SELL!” every five seconds.
How the Stochastic Indicator Is Calculated

The core formula
Stochastic compares the latest close to the recent range:
%K = 100 x (Close - Lowest Low) / (Highest High - Lowest Low)
Use a lookback window (often 14 candles). Then smooth it:
%D = moving average of %K (commonly 3 periods)
Both lines stay on a 0-100 scale.
A quick, real-number example
Over the last 14 candles:
- Highest High = 110
- Lowest Low = 100
- Current Close = 108
So:
- Close - Lowest Low = 8
- Highest High - Lowest Low = 10
- %K = 100 x (8 / 10) = 80
That 80 reading means the close is near the top of the recent range - strong relative momentum, not “overpriced.”
The Most Common Settings (and What They Change)
The famous 14,3,3 setup
You’ll see 14,3,3 everywhere:
- 14 = lookback period (range window)
- 3 = smoothing for %K (depending on platform)
- 3 = smoothing for %D
This is popular because it’s a decent balance of sensitivity and stability.
Faster vs slower settings by timeframe
- Short-term traders might use something like 9,3,3 (more responsive)
- Longer-term traders might prefer 21,3,3 (smoother)
When “more sensitive” becomes “more noise”
Here’s the trap: tightening settings can feel like you’re getting “earlier” entries, but often you’re just getting more false signals. It’s like turning up a microphone so high you hear static instead of the singer.
A good rule: speed up only if your strategy has a filter (trend direction, support/resistance, higher timeframe alignment, etc.).
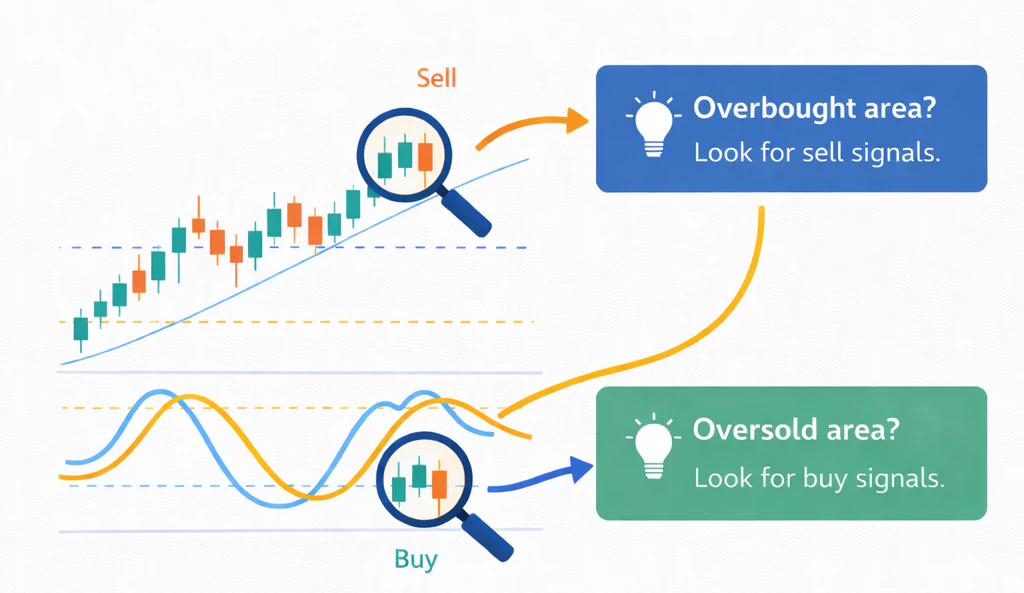
How to Read Stochastic Like a Story
Stochastic becomes way more powerful when you stop reading it like a traffic light and start reading it like a narrative.
Overbought and oversold zones (80/20)
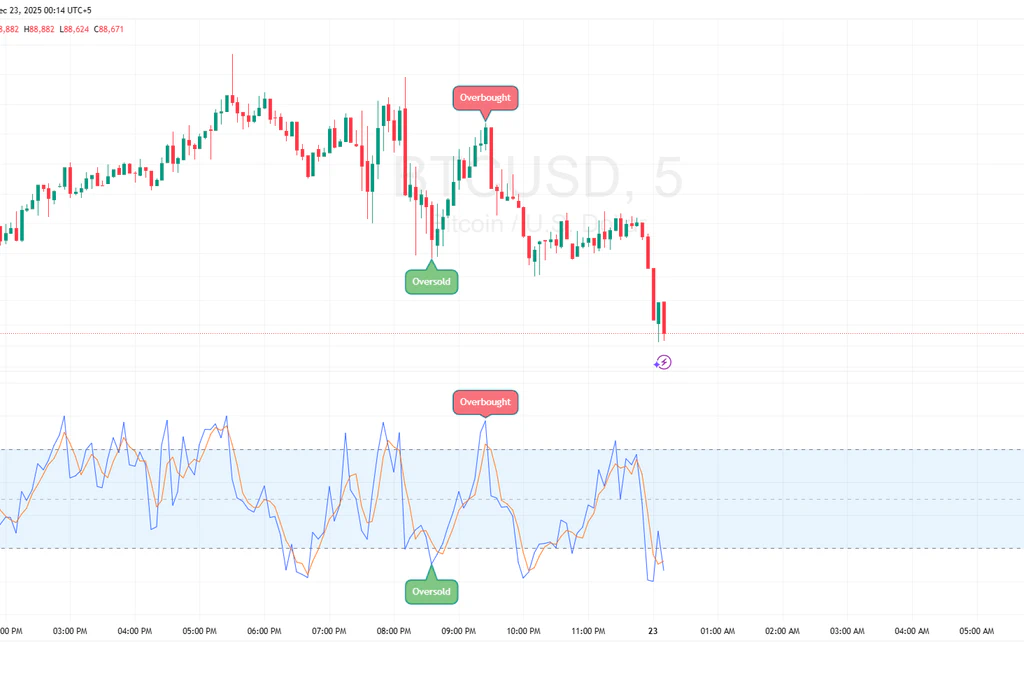
The classic zones:
- Above 80 = overbought
- Below 20 = oversold
But “overbought/oversold” is misleading language. A better translation is:
- Above 80: strong upward momentum
- Below 20: strong downward momentum
Crossovers: the “conversation” between %K and %D
A common signal is when %K crosses %D:
- Bullish crossover: %K crosses above %D
- Bearish crossover: %K crosses below %D
Many traders prefer crossovers that happen inside key zones:
- Bullish crossover below 20
- Bearish crossover above 80
Why? Because you’re combining momentum shift + extreme positioning.
Hooks, turns, and momentum shifts
Sometimes the best clue is not a crossover; it’s the shape.
- When Stochastic “hooks” upward from low levels, it hints selling pressure is fading.
- When it curls down from high levels, it suggests buying pressure is thinning.
It’s like watching a ball thrown upward: the moment it slows near the top matters, even before it drops.
The Big Misunderstanding: Overbought Doesn’t Mean “Sell”

This one saves people money.
In strong uptrends, Stochastic can stay above 80 for a long time. If you short every “overbought” print, you’ll feel like you’re trying to stop a train by yelling at it.
Why strong trends stay overbought/oversold
Because momentum is persistent. In a real trend:
- Buyers keep defending pullbacks.
- Closes keep landing near highs.
- Stochastic stays elevated.
Using trend filters to avoid bad signals
A simple fix: trade Stochastic in the direction of the bigger trend.
Examples of trend filters:
- Price above a 50/200 moving average = focus on long setups
- Higher highs/higher lows = bullish structure
- Downtrend structure = focus on shorts
Stochastic becomes the timing tool, not the decision-maker.
Divergence: When Price and Stochastic Disagree
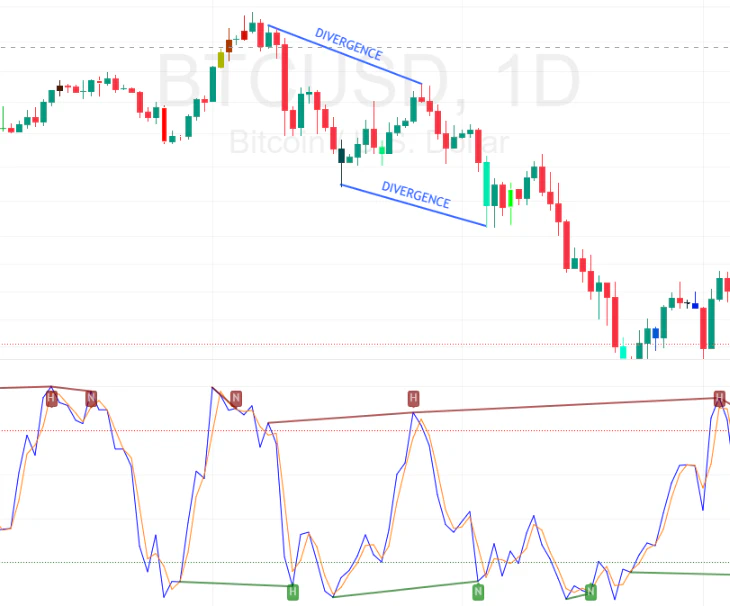
Divergence is where Stochastic starts feeling like a mind reader.
Bullish divergence
This happens when:
- Price makes a lower low
- Stochastic makes a higher low
Translation: price pushed lower, but momentum did not confirm the push. Sellers are getting tired.
Bearish divergence
This happens when:
- Price makes a higher high
- Stochastic makes a lower high
Translation: price climbed, but momentum weakened; buyers are losing punch.
Hidden divergence (trend-continuation clues)
Hidden divergence flips the idea:
- Hidden bullish divergence: price makes a higher low, Stochastic makes a lower low (often suggests trend continuation upward)
- Hidden bearish divergence: price makes a lower high, Stochastic makes a higher high (often suggests trend continuation downward)
If regular divergence hints reversals, hidden divergence often hints “the trend isn’t done yet.”
Best Market Conditions for Stochastic
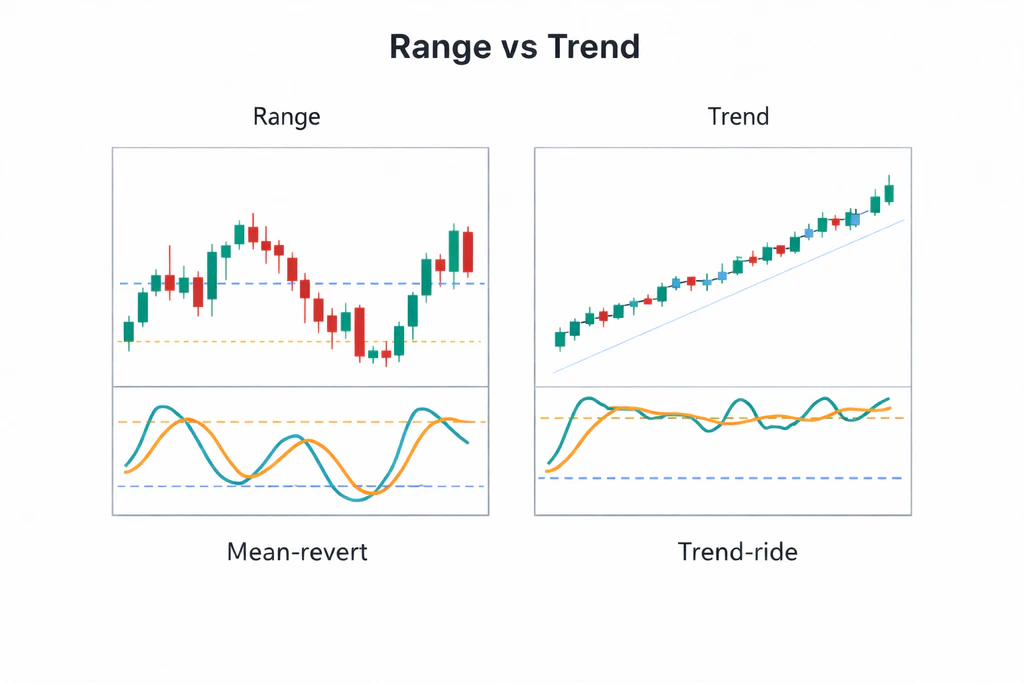
Range-bound markets
Stochastic shines in ranges because price naturally oscillates between support and resistance.
In a range:
- Overbought near resistance can matter
- Oversold near support can matter
- Crossovers tend to be cleaner
Trending markets
Stochastic still works in trends, but you use it differently.
The “zone shift” trick in trends
In uptrends, Stochastic often bottoms around 40-50 instead of 20. In downtrends, it often tops around 50-60 instead of 80.
So instead of obsessing over 80/20, you watch how the oscillator behaves relative to the trend:
- Uptrend pullbacks: look for Stochastic to dip, then turn up (often from mid-zones)
- Downtrend rallies: look for Stochastic to pop, then roll over
Practical Trading Strategies Using Stochastic
Let’s make this usable.
Strategy #1: Range bounce with confirmation
Best for: sideways markets, clear support/resistance.
Entry rules
- Identify a range (multiple touches at support and resistance).
- Wait for price to approach support.
- Stochastic goes below 20.
- Enter when %K crosses above %D (or Stochastic hooks upward) and you see a small price confirmation (like a bullish candle or rejection wick).
Exit rules
- Conservative: exit near mid-range
- Aggressive: exit near resistance
- Protective: stop below the support level (not just “because Stochastic said so”)
Strategy #2: Trend pullback entries
Best for: trending markets where you don’t want to chase.
Moving average filter
- Confirm trend (e.g., price above the 50 MA for longs).
- Wait for a pullback.
- Let Stochastic cool off (often down toward 40-50 in uptrends).
- Enter when Stochastic turns back up and price resumes trend structure.
This is like surfing: you don’t try to stop the wave - you paddle during the lull and catch the next push.
Strategy #3: Support/Resistance + Stochastic Timing
Best for: traders who draw levels.
Multi-timeframe confirmation
- Mark key levels on a higher timeframe.
- Drop to your execution timeframe.
- When price hits a level, use Stochastic to time the entry:
- Oversold + bullish crossover at support = higher-quality long attempt
- Overbought + bearish crossover at resistance = higher-quality short attempt
Levels give context. Stochastic gives timing. Together, they’re much less random.
RelicusRoad Pro
Have you been trading for a while but have never made consistent profits or are you new to FOREX trading and want to get a head start? Try RelicusRoad and you'll never look back.
Get RelicusRoad ProCombining Stochastic With Other Tools
Stochastic is good alone. It’s better with friends.
With moving averages
- MA defines trend bias
- Stochastic handles entries on pullbacks
With RSI or MACD
- RSI can confirm momentum regime (and avoid double-counting extremes)
- MACD can validate trend strength while Stochastic times dips
Tip: don’t stack indicators that all say the same thing. If you use Stochastic + RSI + CCI all together, you’re basically asking three mirrors how you look.
With volume and volatility
- Rising volume on a Stochastic turn can strengthen the signal
- In high volatility, consider wider stops and slower settings to reduce whipsaw
Common Mistakes (and How to Avoid Them)
Trading every crossover
Crossovers happen constantly. Without context, they’re like turn signals in a parking lot: interesting, but not always meaningful.
Fix: require a reason (trend filter, key level, or range boundary).
Ignoring the bigger timeframe
A “perfect” oversold signal on a 5-minute chart can be meaningless if the daily chart is dumping.
Fix: check one higher timeframe for direction or major levels.
Over-optimizing settings
Tweaking settings until your backtest looks flawless usually creates a strategy that only works in the past.
Fix: keep settings simple and focus on rules + context instead.
Risk Management for Stochastic-Based Trades
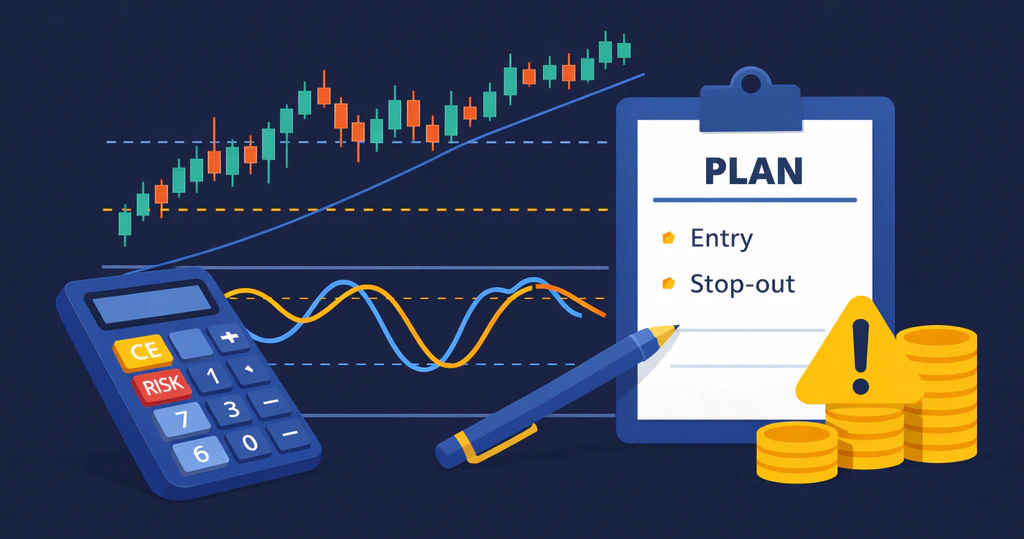
Stochastic tells you about momentum. It does not protect your account.
Stops that make sense
Instead of placing a stop “because Stochastic crossed back,” consider:
- Beyond the recent swing high/low
- Beyond the support/resistance level you’re trading
- With volatility in mind (tight stops in wild markets get hunted)
Position sizing and “signal quality”
Not every signal deserves the same size.
You might risk less when:
- The trend is unclear
- You’re trading mid-range
- The market is news-spiky
And risk normal size when:
- Trend + level + Stochastic align cleanly
Backtesting and Journaling
If you want Stochastic to feel less like guesswork, test it.
What to track
- Timeframe and settings
- Market condition (range vs trend)
- Where the signal happened (at level or in “no man’s land”)
- Win/loss and maximum adverse excursion (how far it went against you)
A simple checklist
Before entering, ask:
- Is the market ranging or trending?
- Am I at a meaningful level?
- Is Stochastic turning in the direction I want?
- Where is my stop, and does that risk make sense?
If you can’t answer in 10 seconds, it’s probably not a clean setup.
Stochastic on Different Assets
Stocks
- Swing trading pullbacks
- Range plays in slower movers Watch out for: gap risk around earnings/news.
Forex
- Ranging pairs
- Session-based swings Watch out for: strong trend days where “overbought” stays overbought.
Crypto
- Momentum timing (especially in chop) Watch out for: volatility whipsaw. Slower settings and higher timeframe context help a lot.
Futures/commodities
- Mean reversion in ranges
- Pullback timing in trends Watch out for: contract-specific volatility and sudden macro moves.
Variants You’ll Hear About

Slow Stochastic
Smoother, fewer fake-outs. Often the default in many platforms.
StochRSI
This is “Stochastic applied to RSI” rather than price. It’s extremely sensitive.
When to use which
- Use standard Stochastic when you want a balanced momentum oscillator.
- Use StochRSI when you want very fast signals (and you have strong filters), because it can hit extremes constantly.
Step-by-Step: Setting Up Stochastic on Any Charting Platform
Adding it
- Open Indicators
- Search “Stochastic” or “Stochastic Oscillator”
- Add to chart
Tweaking it
- Start with 14,3,3
- Set horizontal levels at 20 and 80
- If it feels too jumpy, increase smoothing or length
Alerts
Useful alerts:
- %K crossing %D (bullish/bearish)
- Stochastic entering/exiting 20/80 zones
- Divergence (some platforms support this automatically)
Key takeaways
- Stochastic is a momentum read (range position), not a valuation tool.
- In trends, treat 80/20 as “strong momentum” and use a trend filter.
- In ranges, 80/20 + a crossover can work well when it’s near real levels.
- Use Stochastic for timing; use structure/levels and risk rules for decisions.
FAQs
1) Is the Stochastic indicator better than RSI?
Neither is “better” universally. Stochastic is great at showing where the close sits inside a recent range; RSI is great at measuring average gains vs losses. Many traders pick one to avoid redundant signals.
2) What are the best Stochastic settings for day trading?
Many day traders experiment with 9,3,3 or 14,3,3. The “best” depends on volatility and whether you use filters like trend direction or support/resistance.
3) Should I sell when Stochastic is overbought?
Not automatically. In strong uptrends, Stochastic can stay overbought for a long time. Overbought often means strong momentum, not “must reverse.”
4) What timeframe works best with Stochastic?
It works on any timeframe, but signals are generally more reliable on higher timeframes (like 1H, 4H, daily) because there’s less noise.
5) Can I use Stochastic alone for trading?
You can, but it’s usually stronger with context: a trend filter, a key level, or a market structure read. Alone, you’ll often get chopped up by random crossovers.
Are you using Stochastic as a traffic light, or reading the map it draws for you?